Abdomen
The Abdomen is one scan from AbdomenAtlas 1.1 Mini Dataset, which is a fully-annotated abdominal CT dataset to date, including 9,262 CT volumes with annotations for 25 different anatomical structures.
With recent advances in frontier multimodal large language models (MLLMs) for data understanding and visual reasoning, the role of LLMs has evolved from passive LLM-as-an-interface to proactive LLM-as-a-judge, enabling deeper integration into the scientific data analysis and visualization pipelines. However, existing scientific visualization agents still rely on domain experts to provide prior knowledge for specific datasets or visualization-oriented objective functions to guide the workflow through iterative feedback. This reactive, data-dependent, human-in-the-loop (HITL) paradigm is time-consuming and does not scale effectively to large-scale scientific data. In this work, we propose a Self-Directed Agent for Scientific Analysis and Visualization (SASAV), the first fully autonomous AI agent to perform scientific data analysis and generate insightful visualizations without any external prompting or HITL feedback. SASAV is a multi-agent system that automatically orchestrates data exploration workflows through our proposed components, including automated data profiling, context-aware knowledge retrieval, and reasoning-driven visualization parameter exploration, while supporting downstream interactive visualization tasks. This work establishes a foundational building block for the future AI for Science to accelerate scientific discovery and innovation at scale.
Five representative scientific volumetric datasets highlight the usability of SASAV.
The Abdomen is one scan from AbdomenAtlas 1.1 Mini Dataset, which is a fully-annotated abdominal CT dataset to date, including 9,262 CT volumes with annotations for 25 different anatomical structures.
The Chameleon dataset is a CT scan of a chameleon.
The Miranda is a time step of a density field in a simulation of the mixing transition in Rayleigh-Taylor instability.
The Flame dataset is a simulated combustion 3D scalar field.
The Richtmyer dataset is the entropy field (timestep 160) of Richtmyer-Meshkov instability simulation.
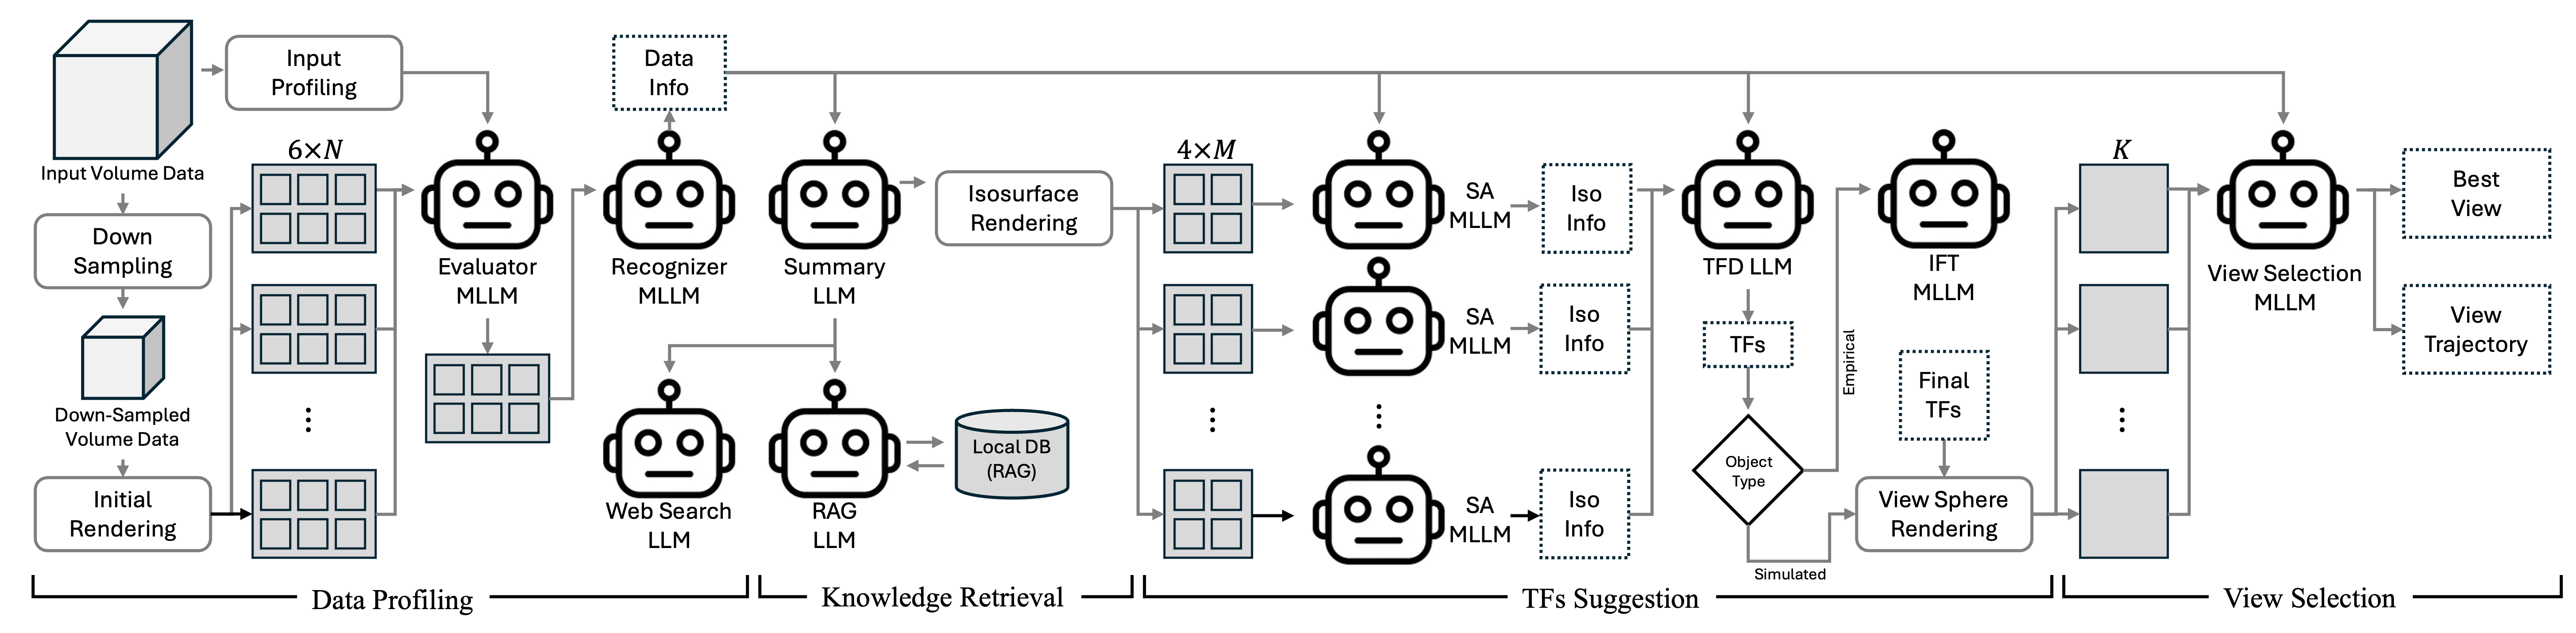
SASAV consists of four steps: 1) Data profiling 2) Knowledge retrieval 3) Transfer functions suggestion 4) View selection
SASAV has a intuitive and minimal user interface, user only needs a API key of their choice of LLM to run SASAV for generating visualize their own scientific data with ease.
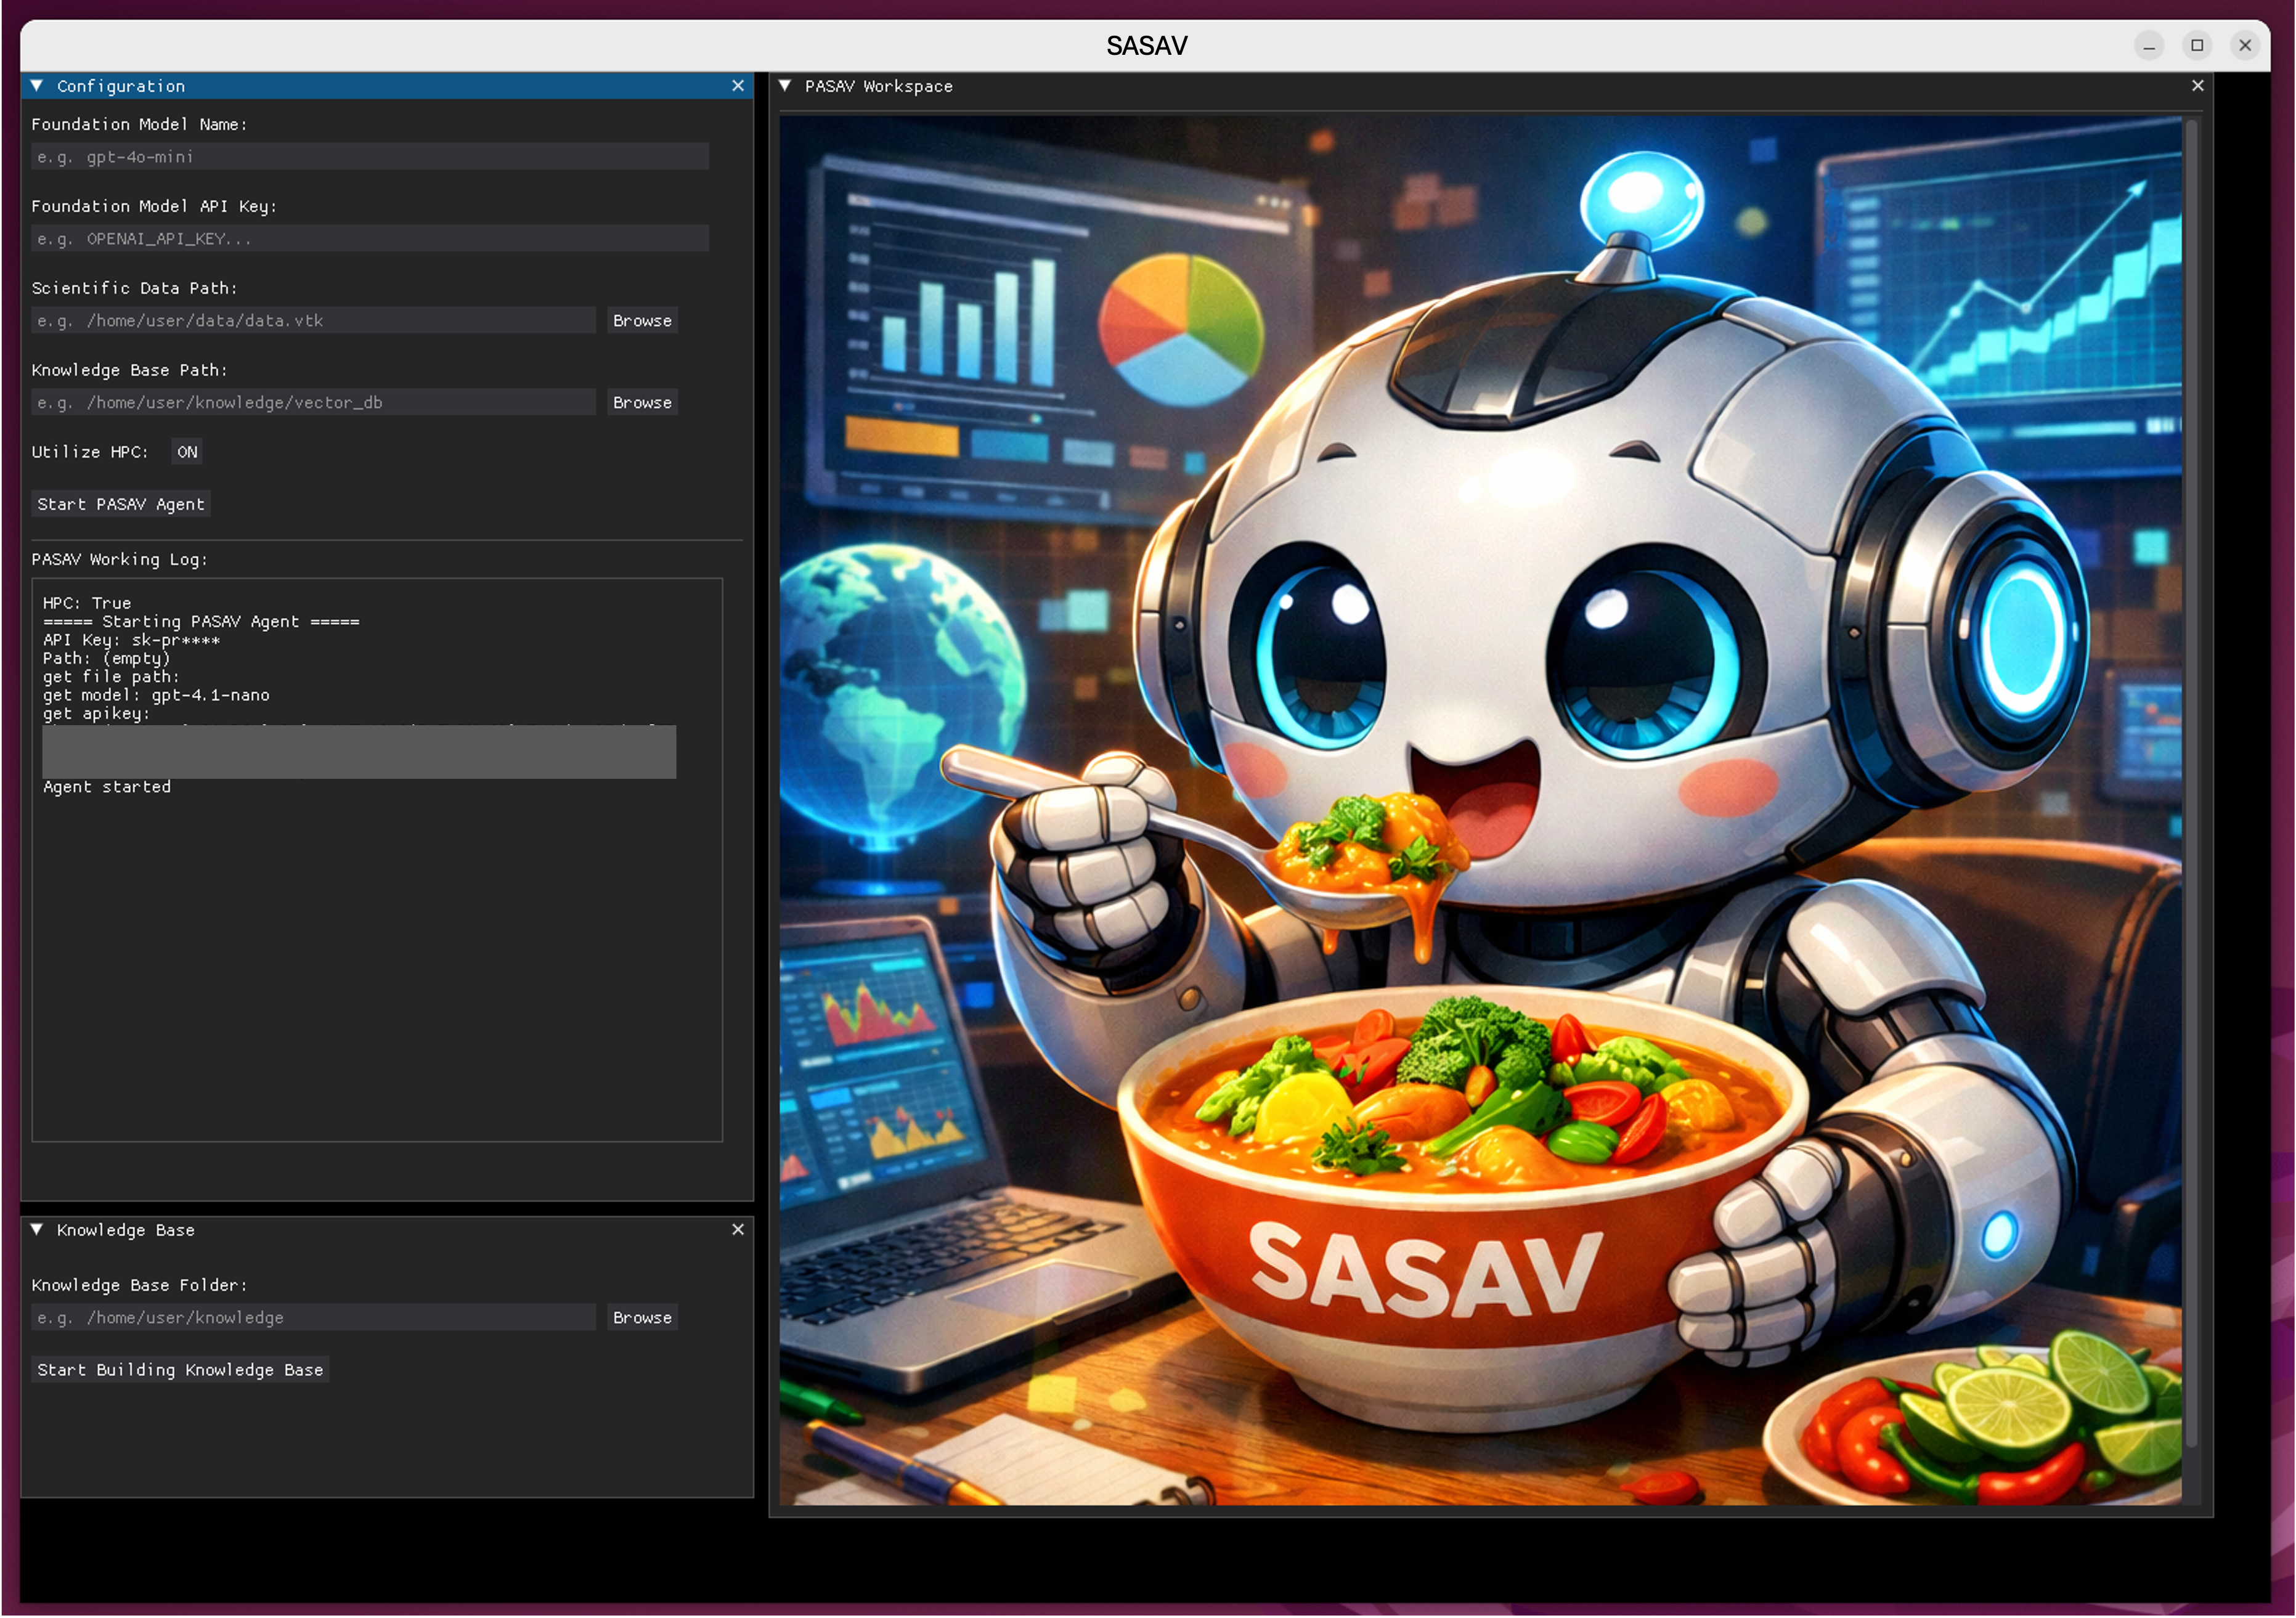
Please refer to the supplimentary video submitted together with the paper for SASAV running demonstration.
A study with three researchers in scientific data analysis and visualization.